
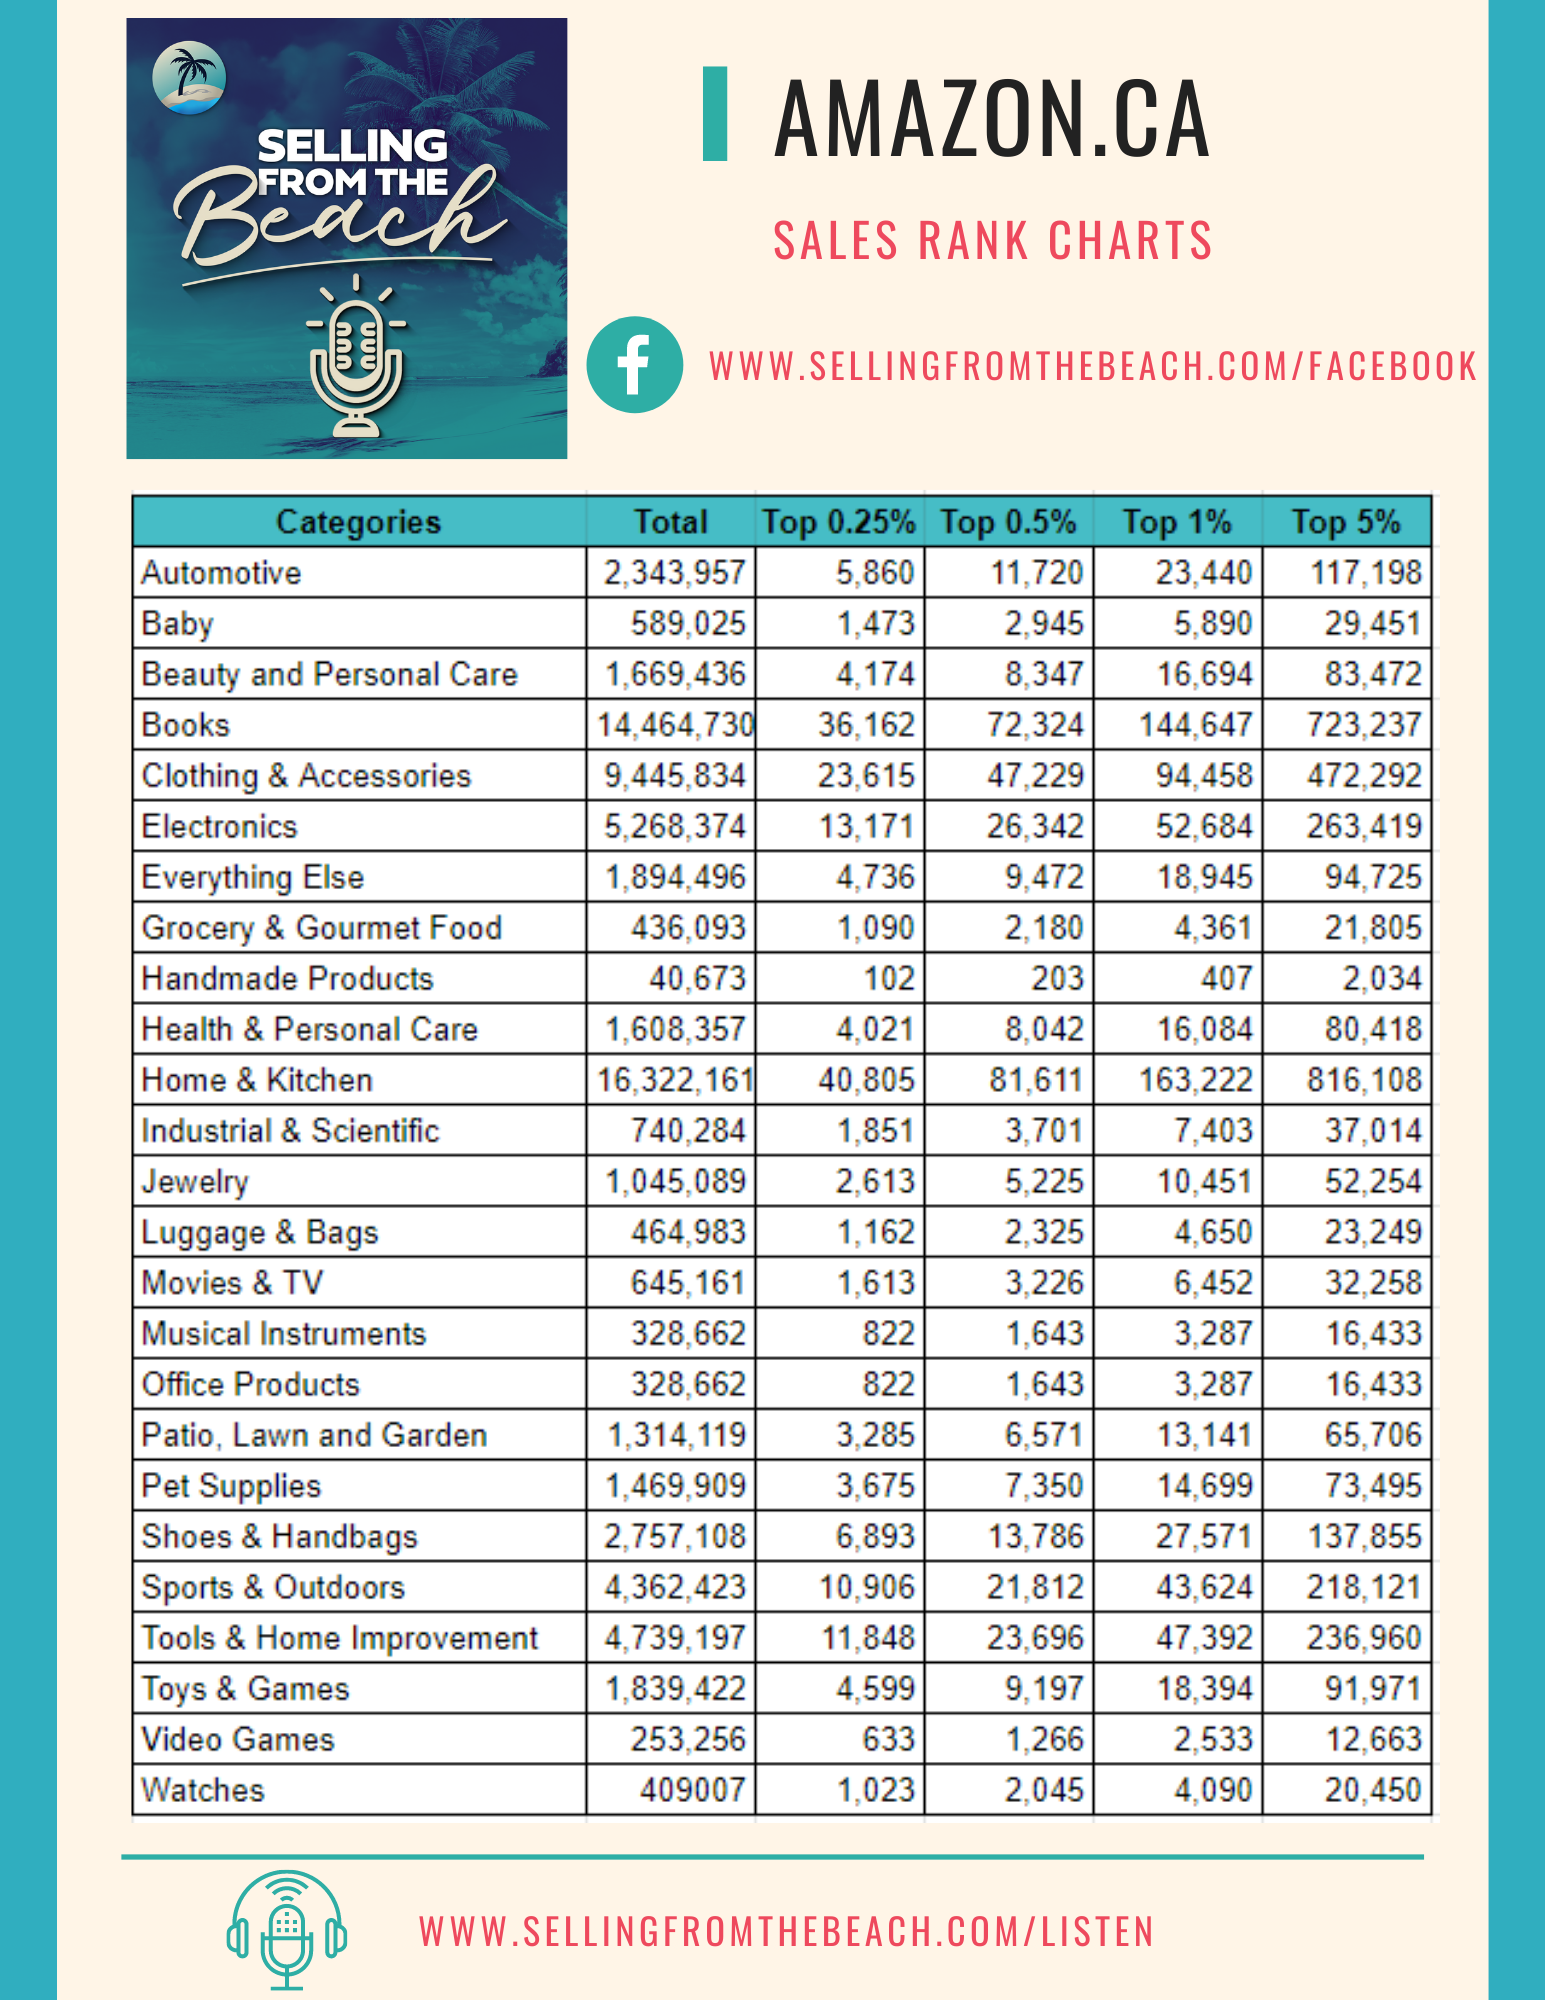
 Amazon.ca Sales Rank Charts[/caption]
How to Use Sales Rank Charts for Smarter Sourcing Decisions
Sales rank charts show you how fast a product is selling relative to other products in its category. A lower rank means faster sales. But the same rank number means very different things in different categories because category sizes vary enormously.
Here is how to interpret the data:
- Toys & Games: A rank of 10,000 might sell 5-10 units per day. The category is massive.
- Industrial & Scientific: A rank of 10,000 might sell 1-2 units per month. The category is much smaller.
- Grocery: Ranks fluctuate wildly because individual purchases are small. Look at the 90-day average, not the current rank.
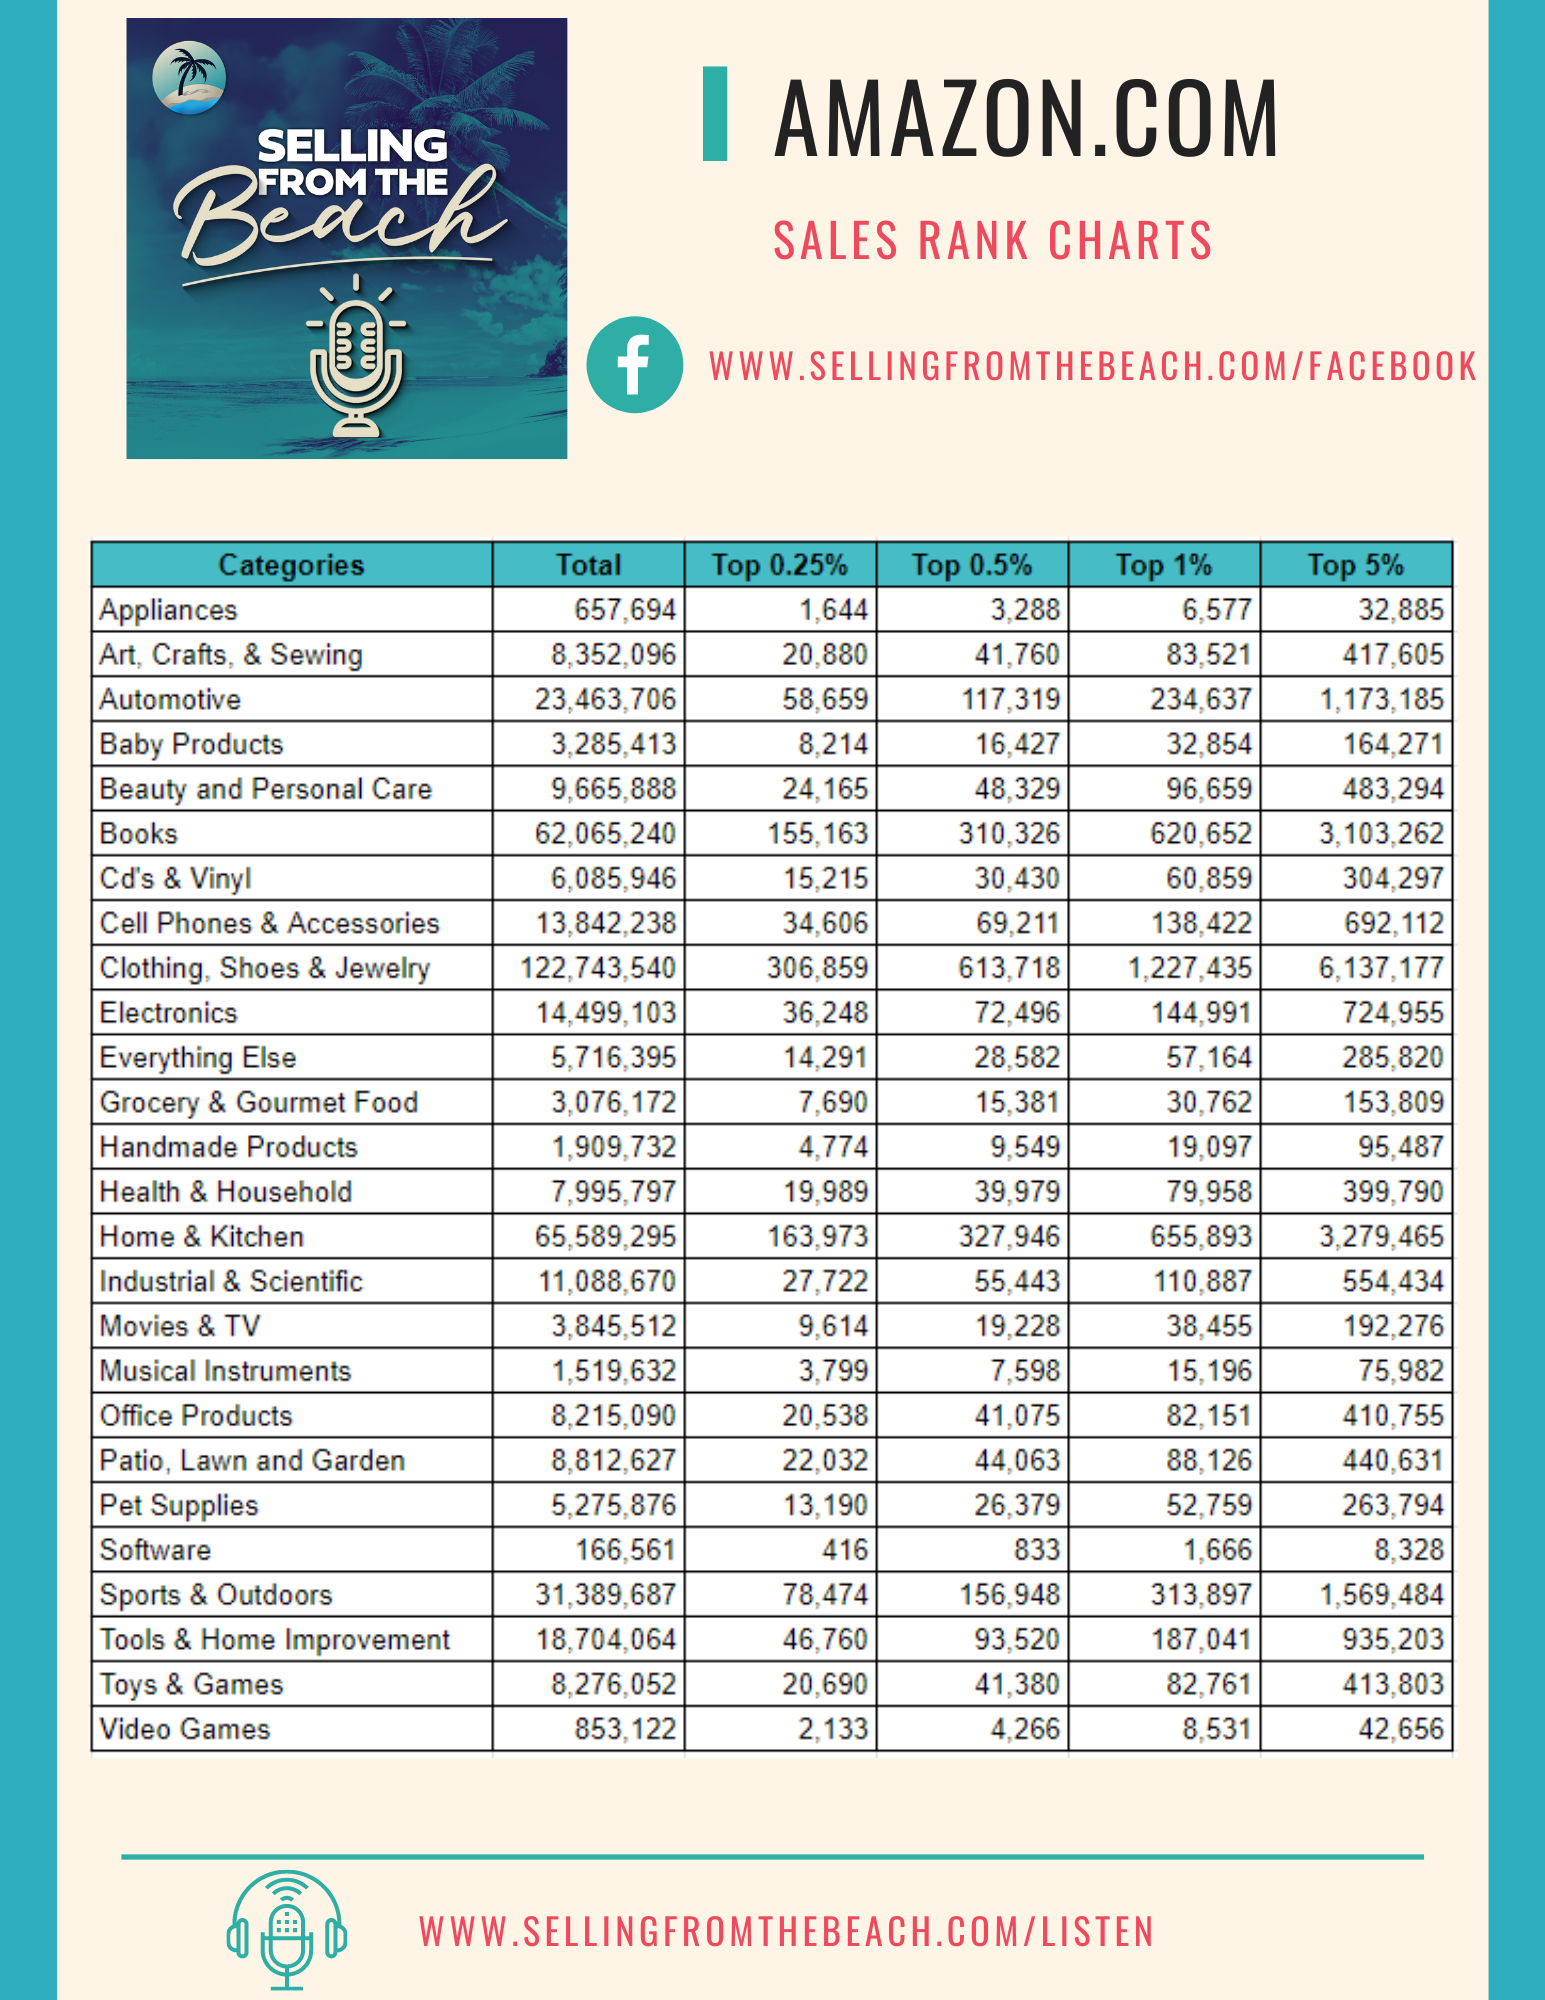
The charts I put together using Keepa data give you percentile rankings within each category. A product in the top 1% of Toys is a very different animal from one in the top 1% of Office Products. Use these benchmarks to set minimum rank thresholds for your sourcing criteria.
Important caveat: sales rank is a trailing indicator. It tells you what happened, not what will happen. Use rank charts as one data point alongside Keepa price history, review velocity, and competitive analysis.
Frequently Asked Questions
What is a good Amazon sales rank for sourcing products?
It depends entirely on the category. In Toys and Games, a rank under 50,000 indicates consistent sales. In Books, you might need a rank under 100,000. In smaller categories like Industrial, a rank under 5,000 is strong. Always use category-specific benchmarks.
How do I read Amazon sales rank charts for product research?
Sales rank charts show what percentage of products in a category sell at or above a given rank. If rank 10,000 is the top 5% in a category, that means 95% of products in that category sell slower. Use these percentiles to set your sourcing criteria.
Does Amazon sales rank update in real time?
Sales rank updates approximately every 1-2 hours based on recent sales. A single sale can dramatically change the rank, especially in smaller categories. This is why looking at the 90-day average rank through Keepa is more reliable for sourcing decisions.